The TurboTenant Rental Trends report expands this week to include analysis for the whole month of March. We are comparing three key data points on a week over week basis as well as monthly trends for new listings. The goal is to get a better understanding of how the coronavirus outbreak is affecting various rental markets across the U.S. Just as the virus’ spread and stay at home orders vary from state to state, so has the impact on rental listings, and rental leads. According to a recent report by Redfin, a national real estate brokerage, on the impact of the coronavirus on the housing market, delistings and new home listings steeply declined in March. While some markets mimicked those trends, others are showing strong numbers as we enter what is historically the peak rental season.
Data:
The TurboTenant Rental Trends report includes four key rental market indicators. Our first data set is total active listings. This analysis looks at the change in the total number of active listings in each location on a week over week basis beginning the week of March 2nd and ending on Sunday April 5th. The next data set we looked at is the total number of new listings for the first week of March compared to the total number of listings for the week ending April 5th. In a pre-coronavirus world historically these numbers have increased as we enter the peak rental season starting in April. Our third data point is total renter leads. Here we analyze the change in the number of renter leads each location reported. Our final data point is the average number of renter leads each property receives. Again, we analyze the reported change on a week over week basis.
Below, we break down the trends reported for 18 major cities across the country.
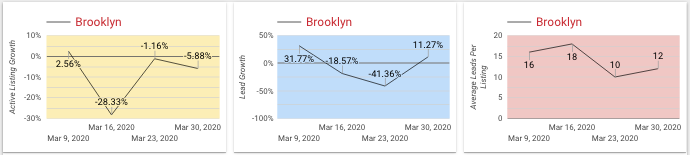
Active Listings: Brooklyn saw a slight increase in the first week, followed by a 28% decrease the following week with minimal recovery.
New Listings: 26% net loss for the month of March.
Renter Leads: Following suit with listings there was an up tick the first of the month, followed by two down weeks and an 11% positive move to close out the month.
Average Renter Leads: Consistent with other losses, average leads per property is down from 16 to 12.
Brooklyn rental inventory, leads and new listings are all trending down with slight up ticks towards the end of the month.
Active Listings: Houston started the month strong with an increase of 11.9% and although it decreased mid-month, listings increased to 18.18% by the end of the month.
New Listings: 38.89% net loss for the month of March.
Renter Leads: Houston’s leads were very strong at an increase of 80.57% at the beginning of March, but then decreased throughout the month, and finally leads made extreme gains at the end of the month at 232.91%.
Average Renter Leads Per Property: Houston’s leads per property started at six and decreased, but then ended the month as it started at six.
Houston rental inventory appears to be trending normally and upward, and rental leads and interest are also trending upward.
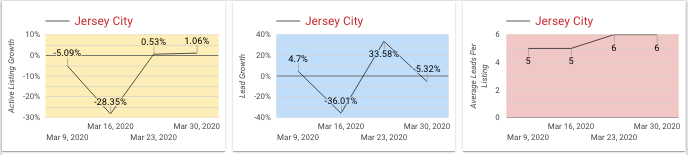
Active Listings: Jersey City started with a decrease of -5.09% active listings and decreased throughout the month, but made gains to end at 1.06%.
New Listings: 69.52% net loss for the month of March.
Renter Leads: Renter leads were up and down throughout the month but started at 4.7% and ended at -5.32%.
Average Renter Leads Per Property: Leads in Jersey City actually stayed the same and then increased starting at five and ending at six.
Jersey City’s rental inventory appears to be trending downward, while rental leads have fluctuated and actually trended upward at the end of the month.
Active Listings: Milwaukee started at a decrease of 10% and then made gains upward ending at a 3.23% increase in listings.
New Listings: 50% net loss for the month of March.
Renter Leads: Lead growth started strong at 15.18%, then dropped mid-month, but made positive gains ending the month at 43.74%.
Average Renter Leads Per Property: Milwaukee started with a strong amount of average leads at 46 and ended the month at 36.
Milwaukee’s rental inventory seems to be normal and is now trending upward, interest in properties and rental leads are also making gains and trending positively.
Active Listings: New York started at a decrease of -20% in listings and dropped even more, but recovered and ended the month at 13.51%.
New Listings: 65.17% net loss for the month of March.
Renter Leads: Renter leads started down this month at -11.11% and then made gains to end the month at 10.34%.
Average Renter Leads Per Property: New York’s average leads mainly remained the same and started at two per property and ended with one per property.
New York’s rental inventory trended downward and is now increasing, but then interest in properties and number of leads per property is trending downwards.
Active Listings: Omaha started the month with an increase of 9.09%, decreased throughout the month, but ended at 9%.
New Listings: 75% net gain for the month of March.
Renter Leads: Omaha started positive at 27.08% and decreased throughout the month ending at a decrease of -24.68%.
Average Renter Leads Per Property: Omaha started the month strong with 17 leads and rapidly decreased ending the month with an average of eight leads per property.
Omaha’s rental inventory appears to be trending upward, but interest in those properties and rental leads are trending down.
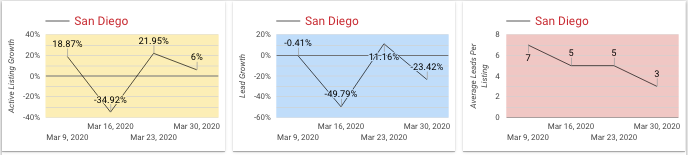
Active Listings: San Diego started the month at a positive 18.87% increase in listings, dropped in the middle, and made a recovery and ended the month at 6%.
New Listings: 3.13% net gain for the month of March.
Renter Leads: San Diego started at a -0.41% decrease in lead growth, and then decreased far below that, but recovered slightly and ended the month at -23.42%.
Average Renter Leads Per Property: San Diego’s leads slowly decreased the whole month starting at seven and ending at three leads per property.
San Diego’s rental inventory appears to be trending normally with both positive gains in listings, but interest in those properties and rental leads are trending down.
Active Listings: Seattle started the month at a decline at -6.25% and increased in the middle of the month and ended the month as it started at -6.25%.
New Listings: 12.5% net loss for the month of March.
Renter Leads: Seattle started the month with a -29.62% and made large gains in the middle of the month, but ended at -32.08%.
Average Renter Leads Per Property: Seattle’s lead averages for march started at seven and slowly decreased to only four leads per property.
Seattle’s rental inventory is declining as well as interest in those properties – however, rental leads only decreased by three.
You can view all data visualizations here. If you have data requirements that are outside the scope of this article, please email [email protected]. We have a plethora of data and are happy to supply another data set if it is available.
Creative financing can offer real estate investors options beyond traditional lending from banks. If you have less-than-ideal credit or lack a sizeable...
If you came here wondering how to write a lease agreement, look no further. Creating iron-clad rental contracts is essential for protecting the rights...