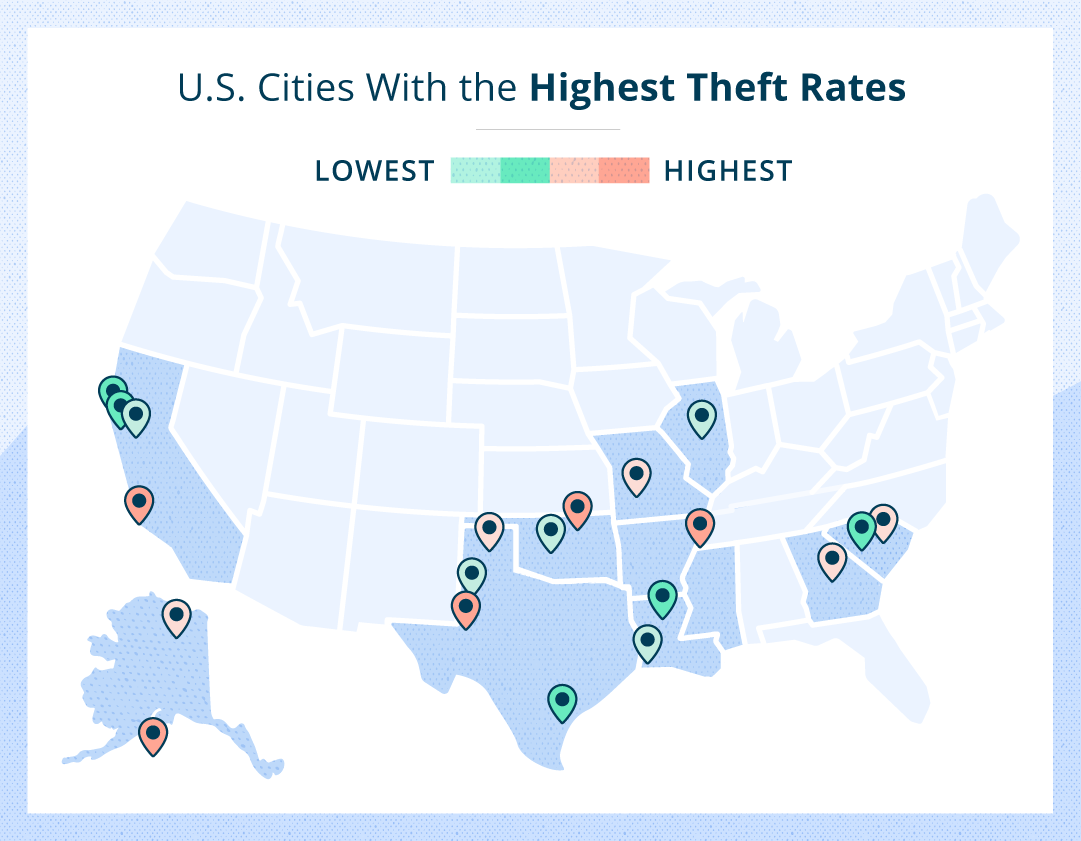
You refurbished a perfectly walkable unit in a bustling metropolitan area with upgraded shaker black cabinets and quartz countertops. Inside, it’s a renter’s dream. But what happens when their sense of safety is jeopardized after a home burglary? The downside of renting out a property in a greater metropolitan area, for landlords and tenants, is often the concern of crime. From auto theft and burglaries to petty larceny-theft and dangerous robberies, no one wants to feel unsafe in their home.Luckily, as a landlord, there are ways you can provide renter security and reduce your liability in theft-prone communities. We analyzed 281 metro areas across the United States and ranked them from worst theft rates to best based on weighted values per capita using four types of theft: auto theft, burglaries, robberies, and larceny-theft.So which areas may you want to consider a new security system?
As a landlord, you should take precautionary steps to limit theft on your property. Screen your applicants, be aware of suspicious activity, secure the building, and inspect your property for defective security measures.10 Metro Areas With the Worst Theft Rates
Lubbock, TX
Memphis, TN-MS-AR
Anchorage, AK
Bakersfield, CA
Tulsa, OK
Macon-Bibb County, GA
Springfield, MO
Amarillo, TX
Fairbanks, AK
Florence, SC
What Are the Different Types of Theft?
Theft can be complex for landlords when it comes to liability. If any of the types of theft below occur on your property and you didn’t have the proper security in place, you may be at fault.
Auto theft: Attempted theft of a motor vehicle. Stealing car parts versus the entire vehicle is considered larceny-theft. Average cost for victim: $8,886 per stolen vehicle
Home burglary: Non-violent unlawful entry into any permanent dwelling is considered burglary. Average cost for victim: $2,661 per offense
Robbery: Theft with harm, or with the intent to harm, is considered a robbery. Average cost for victim: $1,797 per offense
Larceny-theft: Sometimes called petty theft, this crime can involve stealing packages, bicycles, car parts, or pick-pocketing without involving force. Average cost for victim: $1,162 per offense
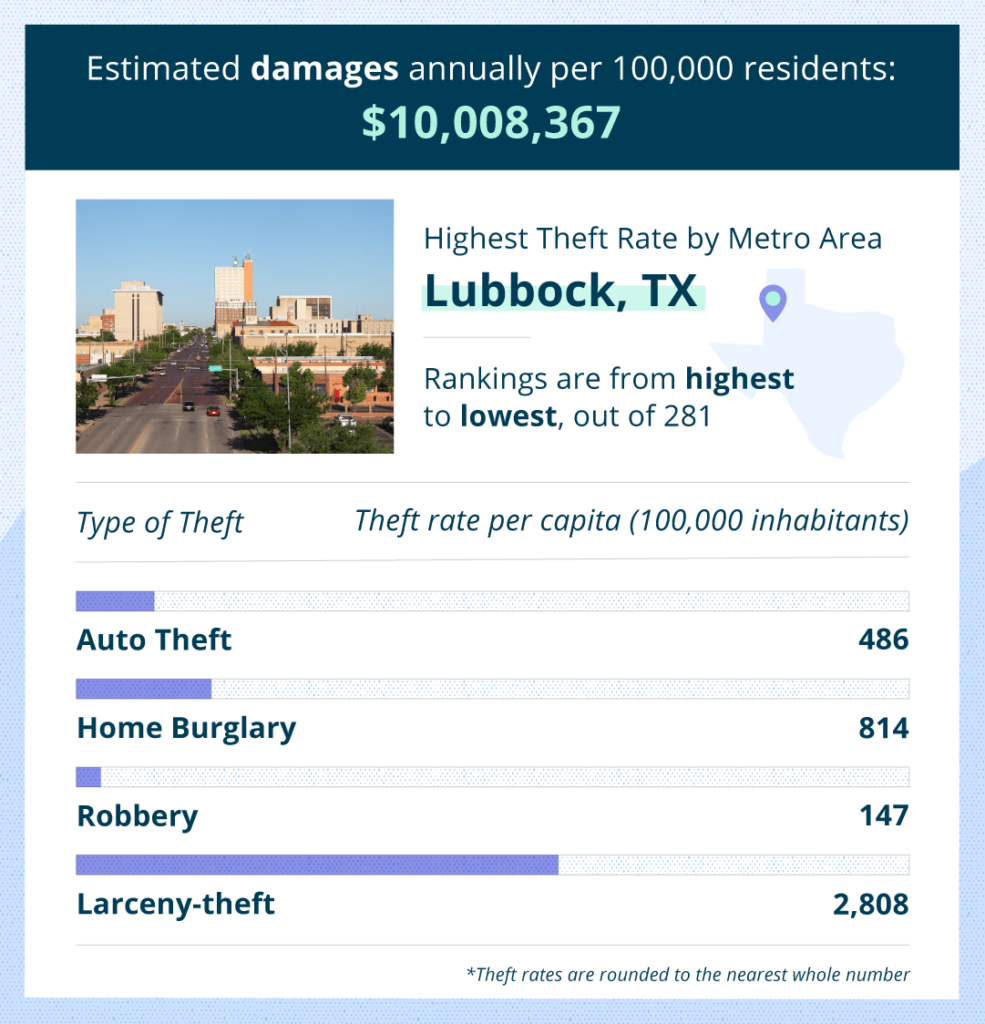
1. Lubbock, TX
Nestled in the Panhandle of Texas is the epicenter of thefts in United States metro areas. Let’s take a look at the figures that stole the Lone Star State number one for metro areas with high theft.
Population: 322,257
Total auto thefts: 1,565
Total burglaries: 2,623
Total robberies: 474
Total larceny-thefts: 9,048
In 2020, searches for the term “robbery” peaked in February, April, June, and August in Lubbock, Texas.Landlord tip: Advertise upgraded security systems during peak months.
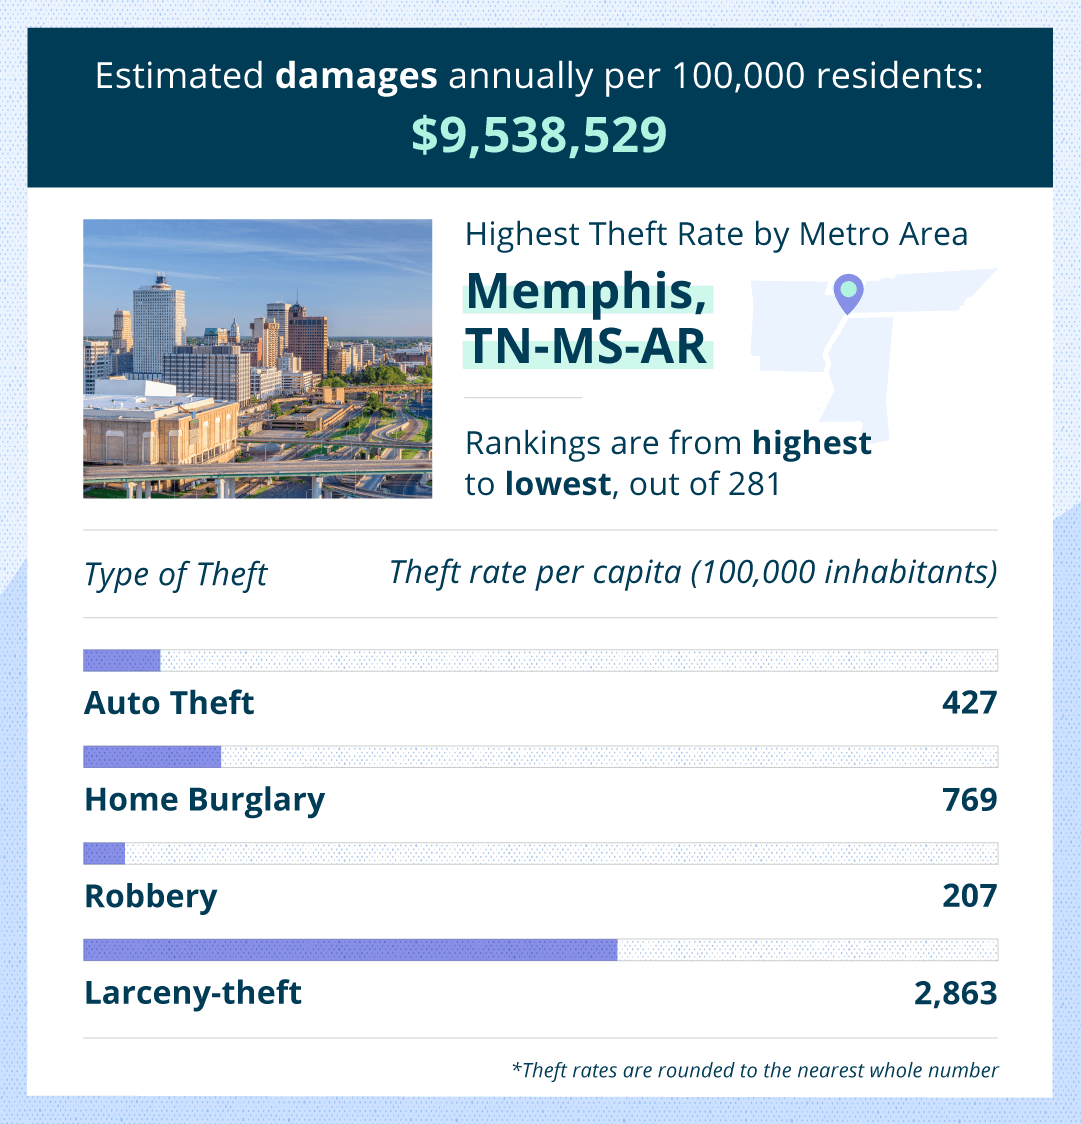
2. Memphis, TN-MS-AR
Memphis is coveted for music, barbecue, and, surprisingly, fresh water. Unfortunately, as the population grows, so does the number of thefts per capita.
Population: 1,346,045
Total auto thefts: 5,746
Total burglaries: 10,351
Total robberies: 2,788
Total larceny-thefts: 38,537
In the last year, searches for the term “burglary” peaked in October, March, and June in Memphis, TN.Landlord tip: Advertise upgraded locks during peak months.
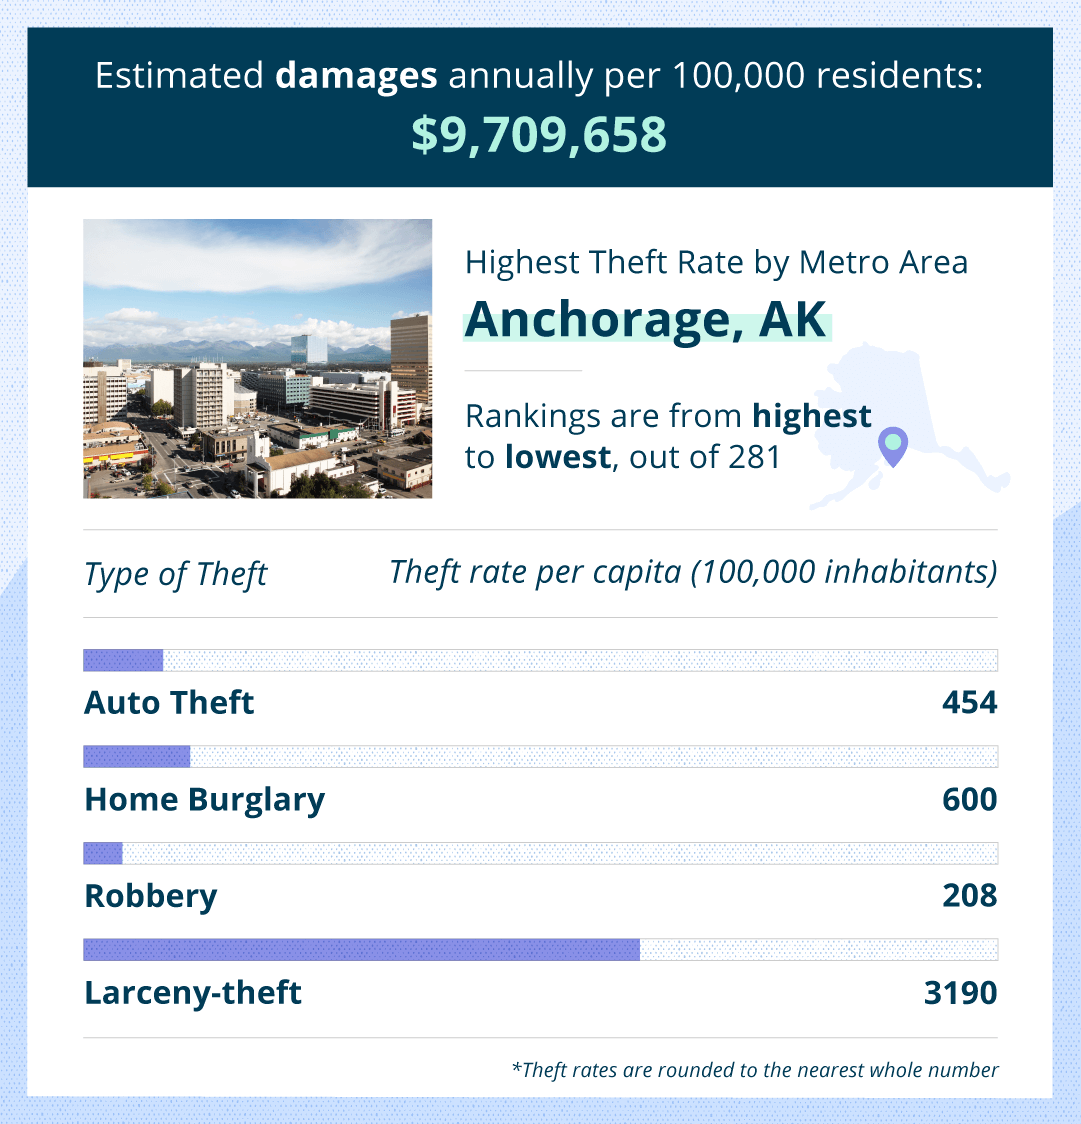
3. Anchorage, AK
While many think of Alaska as a sparse state teeming with more wildlife than people, Anchorage is a bustling metropolis. Notably, the area has a coffee shop for every 1,600 residents, but their theft rates are just as high.
Population: 396,317
Total auto thefts: 1,798
Total burglaries: 2,378
Total robberies: 826
Total larceny-thefts: 12,643
From October 2019 to November 2020, searches for the term “auto theft” peaked in December and January in Anchorage, AK.Landlord tip: Advertise gated parking during peak months.
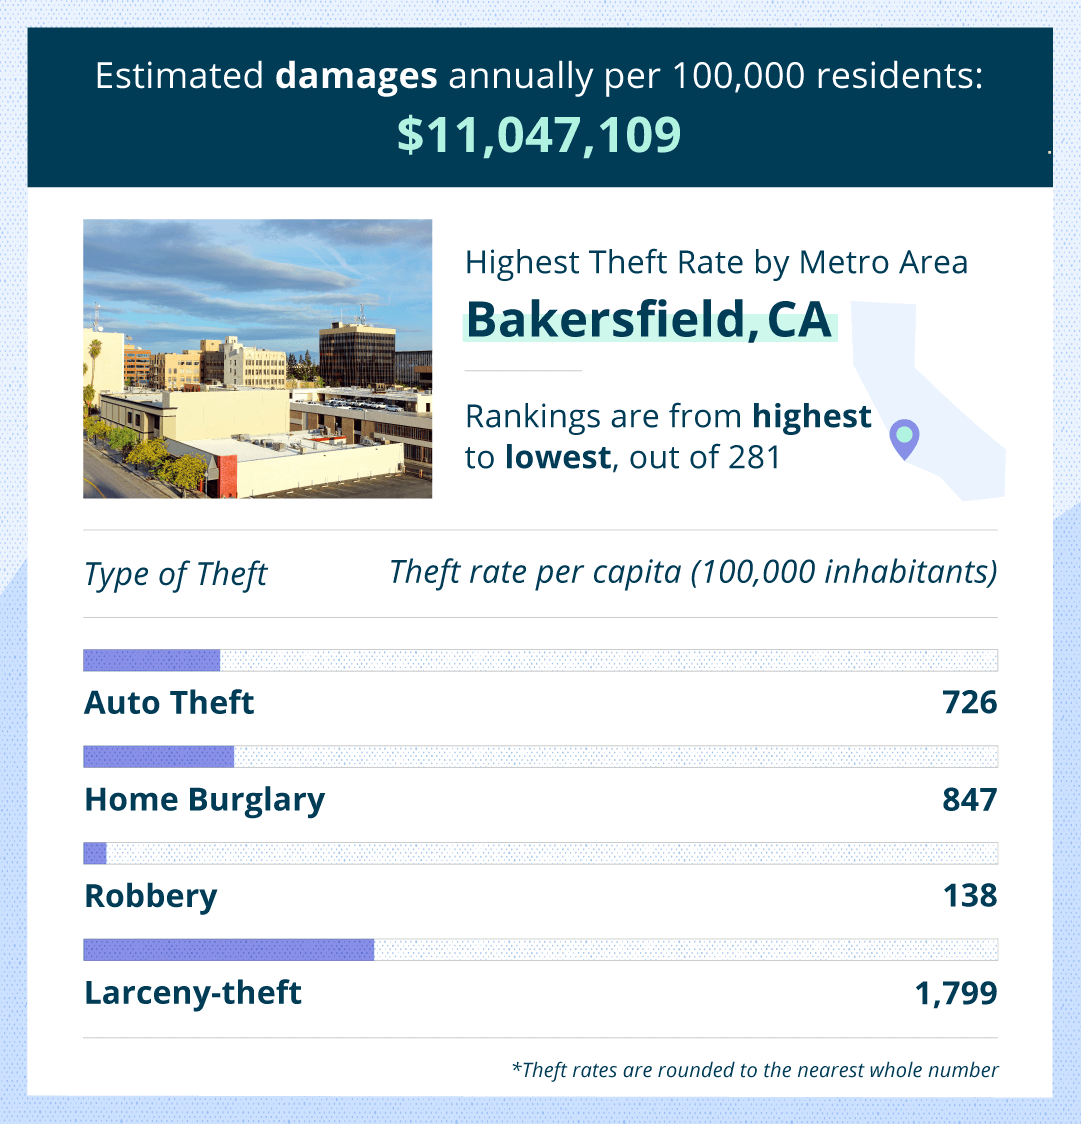
4. Bakersfield, CA
Bakersfield lies on the southern end of central California. While one might expect Los Angeles to rank in the top five for thefts over its lesser-known counterpart, reports show the chances of being involved in property crime in Bakersfield is one in 23 — the highest in all of California.
Population: 900,202
Total auto thefts: 6,537
Total burglaries: 7,627
Total robberies: 1,243
Total larceny-thefts: 16,192
Since October 2019, searches for the term “larceny” peaked in December and March in Bakersfield, CA.Landlord tip: Advertise a locked mailroom or nearby Amazon lockers during the peak months.
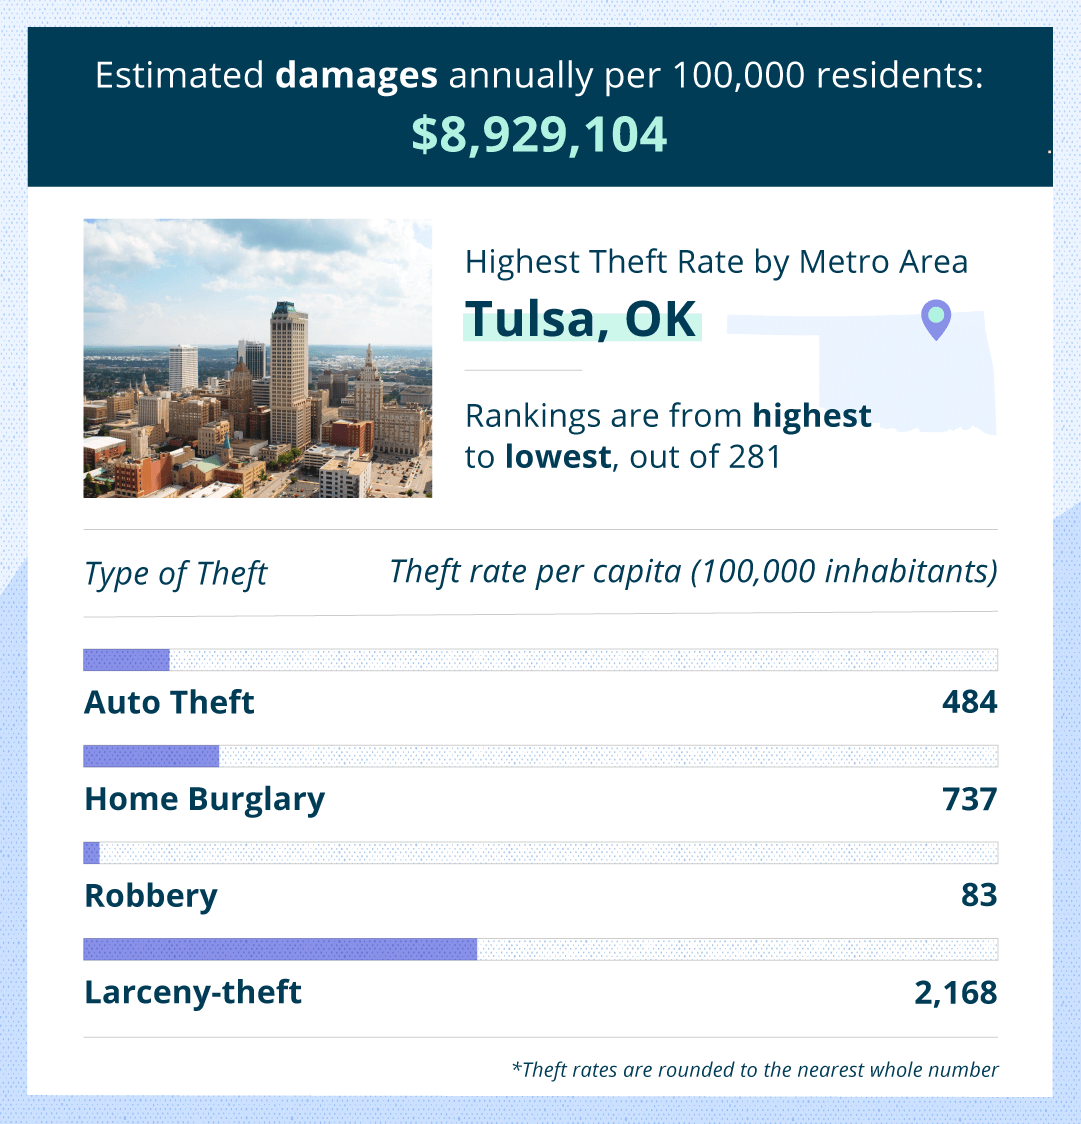
5. Tulsa, OK
In the 20th century, construction in Tulsa flourished thanks to the prosperous oil industry. Once a place of privilege, the Art Deco construction now boasts history lessons for its visitors. Unfortunately, Tulsa also boasts one of the highest theft rates per capita.
Population: 998,626
Total auto thefts: 4,832
Total burglaries: 7,360
Total robberies: 829
Total larceny-thefts: 21,650
In 2020, searches for the term “burglary” peaked in February, May, and August in Tulsa, OK.Landlord tip: Advertise upgraded locks and security systems during peak months.
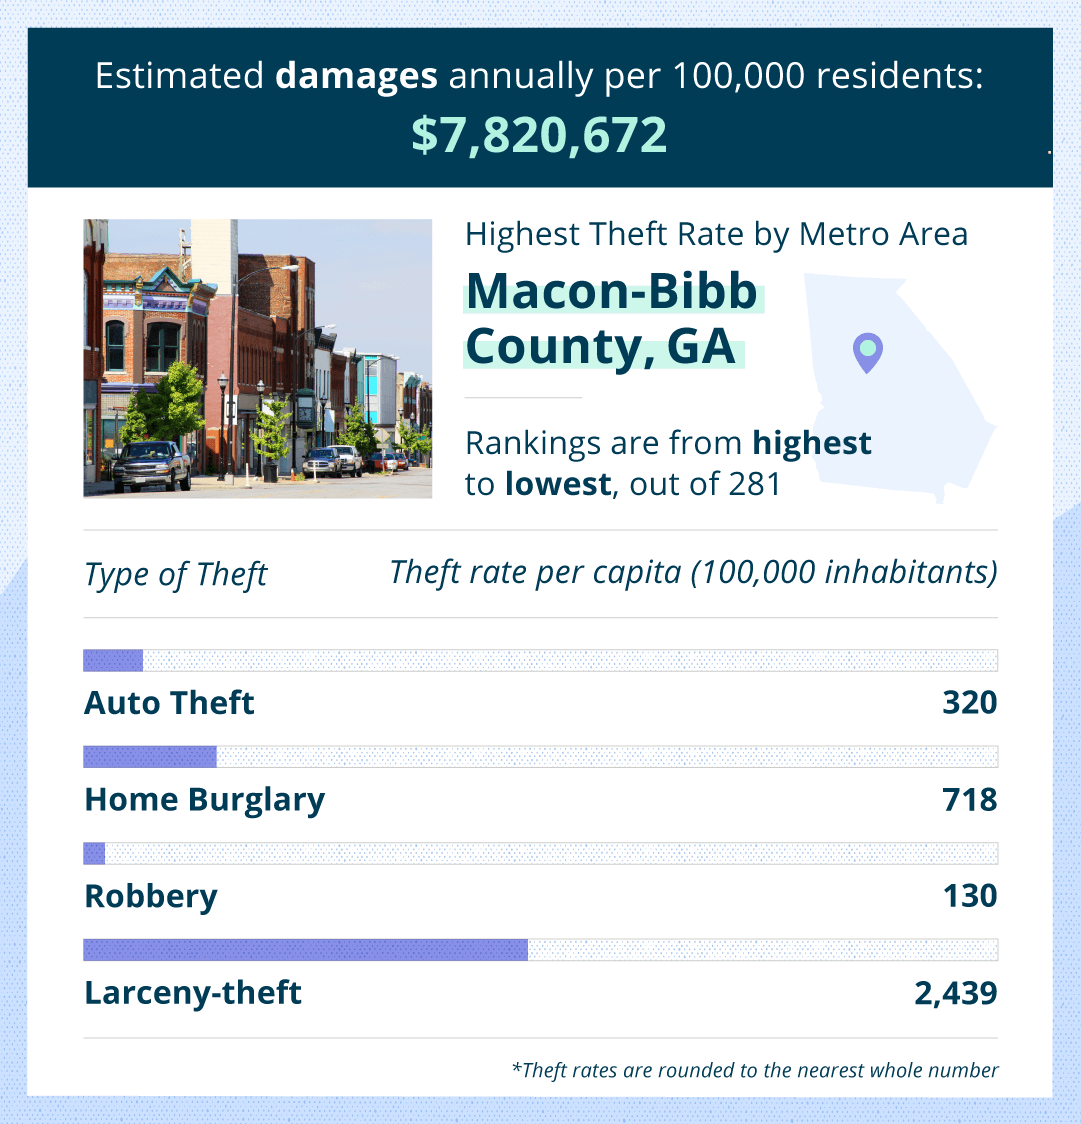
6. Macon-Bibb County, GA
Native American history is rich in Macon, GA. Some folklore suggests the area is cursed, and that might be reflected in the high crime and theft rates in the metro area.
Population: 229,996
Total auto thefts: 736
Total burglaries: 1,651
Total robberies: 299
Total larceny-thefts: 5,609
From October 2019 to November 2020, searches for the term “larceny” peaked in December to April and August in Macon, GA.Landlord tip: Advertise a locked mailroom or nearby Amazon lockers during the peak months.
7. Springfield, MO
Springfield is the birthplace of Route 66 and home to three universities. While the amount of violent crimes is relatively low, there is no shortage of property crime in the area.
Population: 470,300
Total auto thefts: 2,420
Total burglaries: 2,889
Total robberies: 348
Total larceny-thefts: 12,295
In 2020, searches for the term “burglary” peaked around mid-month each month in Springfield, MO.Landlord tip: Advertise upgraded locks and security systems during peak months.
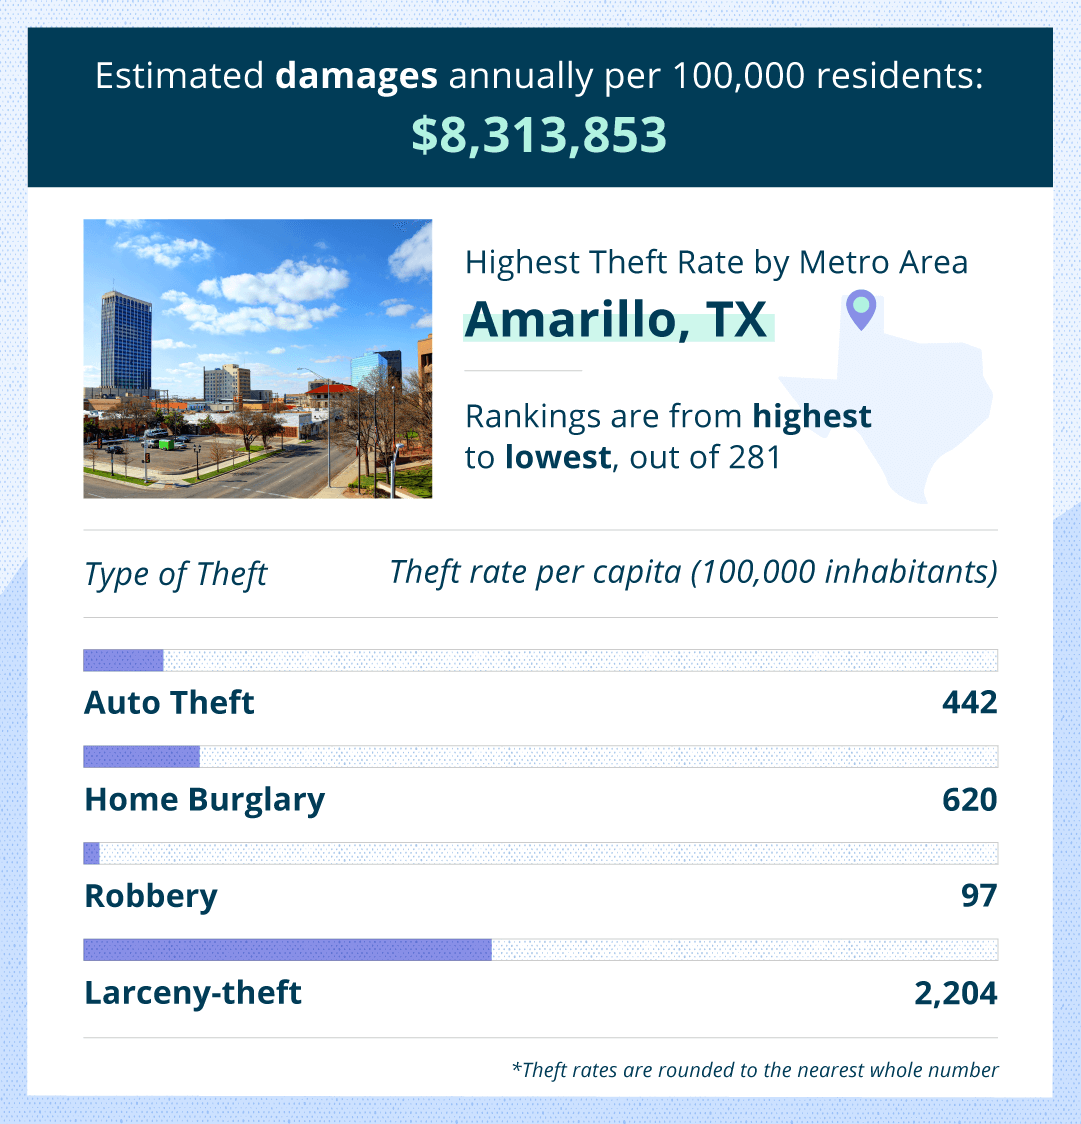
8. Amarillo, TX
You may have seen idyllic models posing next to the infamous graffiti-decorated cars on your Instagram. Surprisingly, those photographers likely came and went — as crime rates in Amarillo are one of the highest for Texas.
Population: 265,053
Total auto thefts: 1,172
Total burglaries: 1,644
Total robberies: 256
Total larceny-thefts: 5,841
In 2020, searches for the term “auto theft” peaked in January, February, and July in Amarillo, TX.Takeaway: Advertise gated parking during peak months.
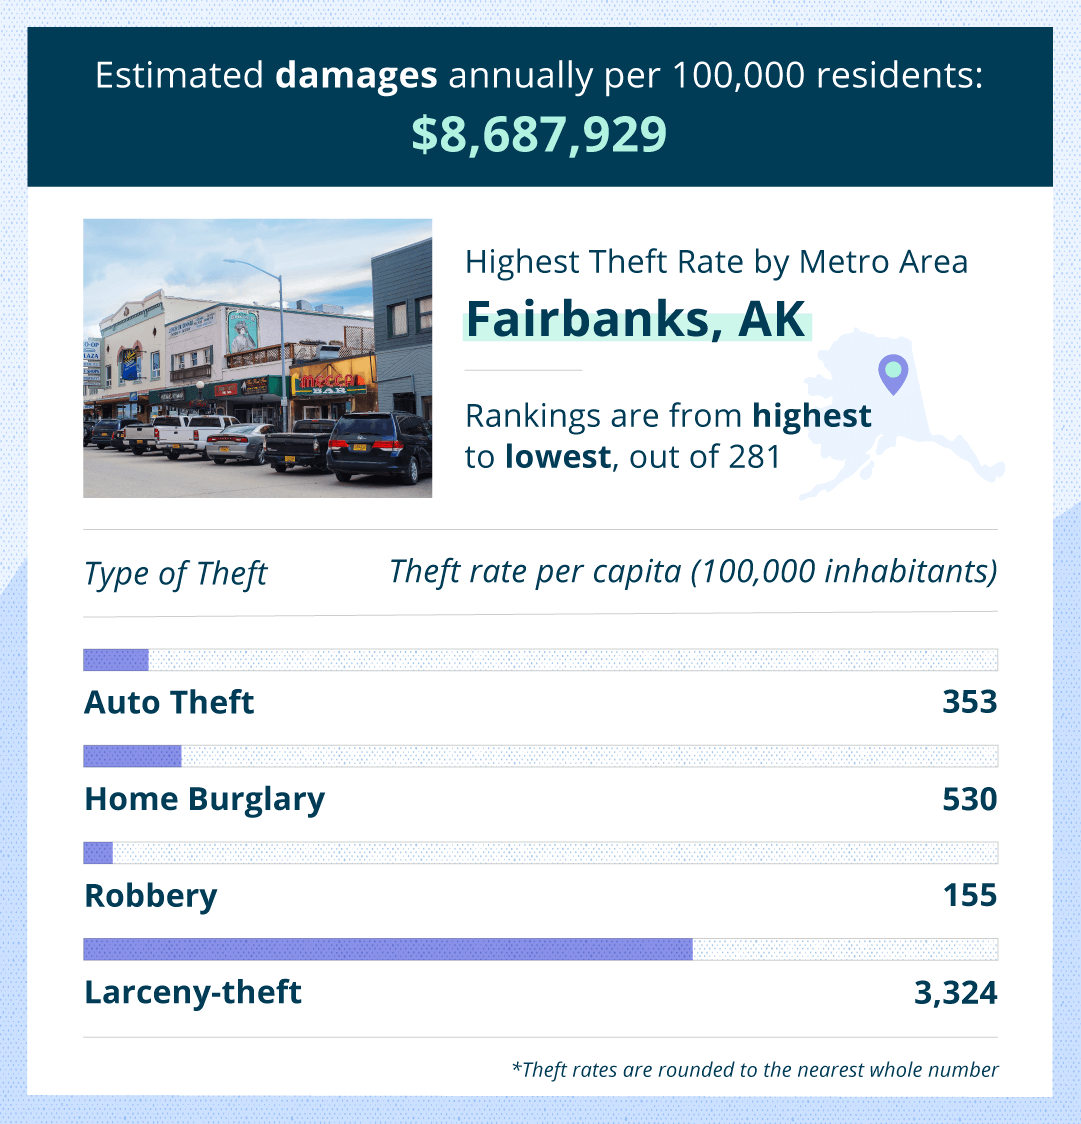
9. Fairbanks, AK
In Fairbanks you’ll see aurora borealis and midnight sunsets. Perhaps its low law enforcement to resident ratio is what topples its theft rates into the top 10 metropolitan areas.
Population: 96,849
Total auto thefts: 342
Total burglaries: 513
Total robberies: 150
Total larceny-thefts: 3,219
Since October 2019, searches for the term “robbery” peaked in December and the majority of the spring season in Fairbanks, AK.Landlord tip: Advertise upgraded security systems during peak months.
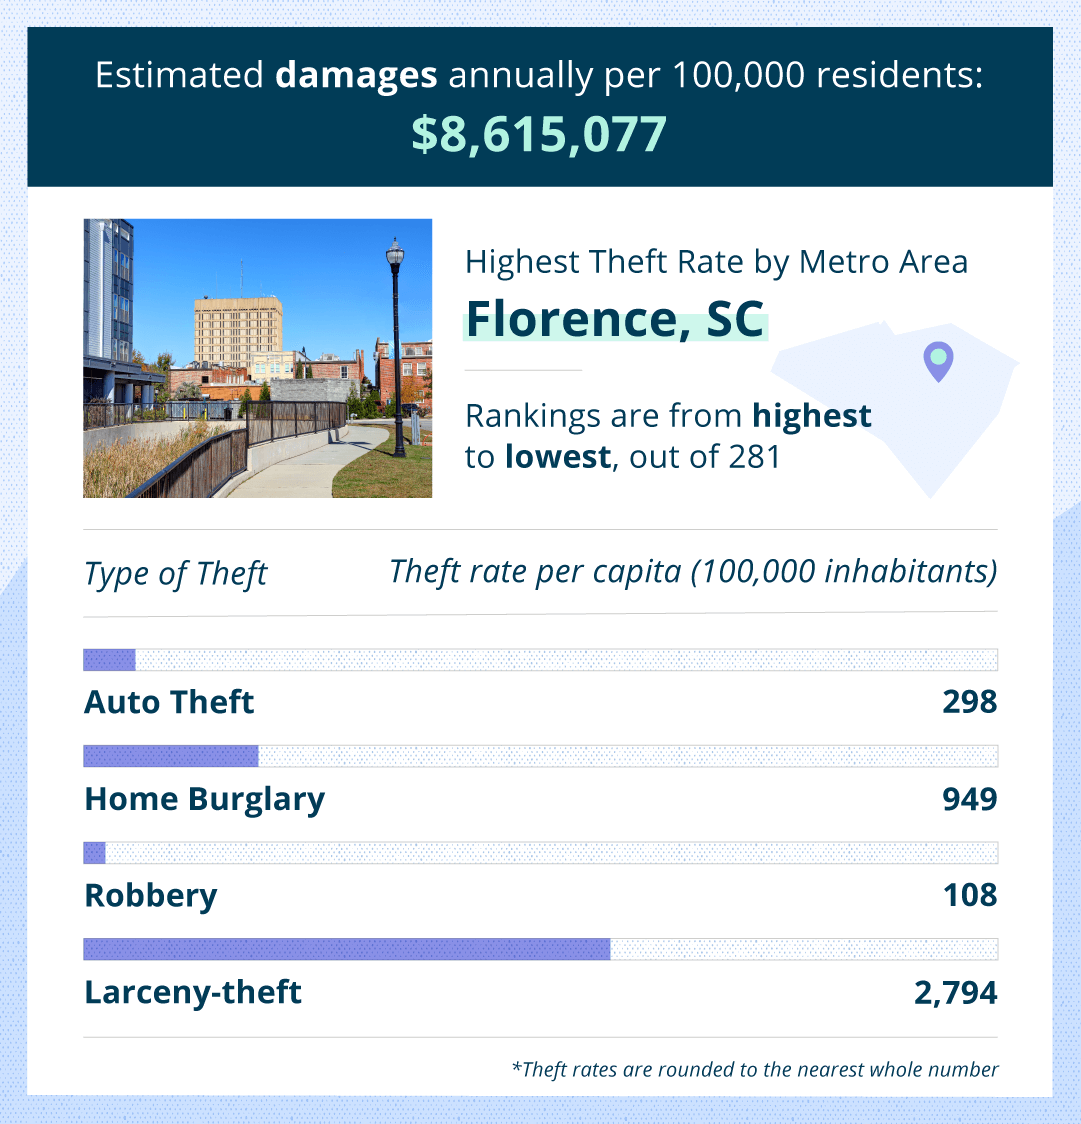
10. Florence, SC
Historically, Florence was a railroad hub for three major systems. As shipping freight by rail dwindled, theft seemed to increase. Today, this quaint metropolis ranks tenth for areas with the highest theft rates.
Population: 204,911
Total auto thefts: 1,944
Total burglaries: 611
Total robberies: 5,726
Total larceny-thefts: 221
From October 2019 to October 2020, searches for the term “burglary” peaked around mid-month every month in Florence, SC.Landlord tip: Advertise upgraded locks during peak months.
Theft Protection Tips for Landlords
Landlords should consider theft as it relates to rental properties in two ways. The first is providing adequate safety for the tenants and the second is to limit landlord liability. Always check state and local laws for specific safety requirements in your area and purchase landlord insurance on your property.
Follow locational security requirements: Local and state laws for security requirements on rentals will vary. Check your local ordinances and follow specific provisions. Always disclose in the rental agreement whether or not tenants are responsible for property theft.
Perform inspections:Inspect your property frequently to fix outdated or defective security systems including broken locks and burned out exterior light bulbs.
Provide adequate security and resources: The security on your property should provide reasonable protection for renters. Landlords may be liable for criminal conduct on the property if adequate security is not present. Educate your tenants about crime in the area and explain the resources they have available.
Address complaints: By addressing complaints quickly, you lessen your liability should an incident happen after a security complaint was submitted.
Adjust rates accordingly: If additional security costs are not within the property management budget, adjust rates for tenants after discussing the risks of not having the additional security.
Screen your tenants and personnel: As a precautionary measure, property managers, tenants, maintenance workers, and cleaning staff should all pass background checks before they’re given access to the property.
Theft is inevitable in some parts of the United States, but proper safety measurements can reduce the risk for both you and your tenants. Know what security measures to invest in for eager rental applicants to make their living space safe and comfortable while mitigating your own liability.Methodology:Our list of metropolitan areas with the lowest and highest theft rates was calculated based on the Metropolitan Statistical Areas (MSAs) in the United States, according to 2019 population estimates from U.S. census data. This list was narrowed down to 281 metro areas based on availability for complete theft data. Areas with incomplete data were removed.Overall theft per capita (burglaries, auto theft, robbery, and larceny-theft) was calculated for each metro area. These factors were ranked according to value and assigned a weight based on the average cost of the type of theft. The total score is a weighted average of four categories.Here was how we weighted each item:
Auto theft — 36%
Burglaries — 26%
Robberies — 21%
Larceny-theft — 17%
To find when people are most concerned about certain types of theft, we analyzed Google trends between October 14, 2019, to November 2, 2020, to map the months where one of four searches (burglary, auto theft, larceny, robbery) in each metro area was highest.Sources: U.S. Census Bureau | NICB | FBI: UCR 1, 2, 3, 4, 5
Krista Reuther is the Senior Content Marketing Writer at TurboTenant where she writes data-driven, actionable material to help landlords and renters alike.
Discover the benefits and considerations of Portable Tenant Screening Reports (PTSRs), which offer a cost-effective, reusable screening option for tenants and require...
TurboTenant leads as the best landlord app of 2024, offering a suite of essential property management tools—from tenant screening to rent collection—designed...
Join the 600,000+ independent landlords who rely on TurboTenant to create welcoming rental experiences.
No tricks or trials to worry about. So what’s the harm? Try it today!